
Use Trends for process behavior
Attach only the signals relevant to the event and confirm every source is running. Capture a stable period before the action, the action itself, and recovery. Keep units and decoding definitions with the project so exported numbers remain interpretable.
Use Raw Traffic for protocol behavior
Record when investigating exceptions, retries, latency, unexpected function codes, or malformed responses. Filter after the capture rather than discarding surrounding frames too early; the request immediately before the failure is often relevant.
Keep a small reproducible package
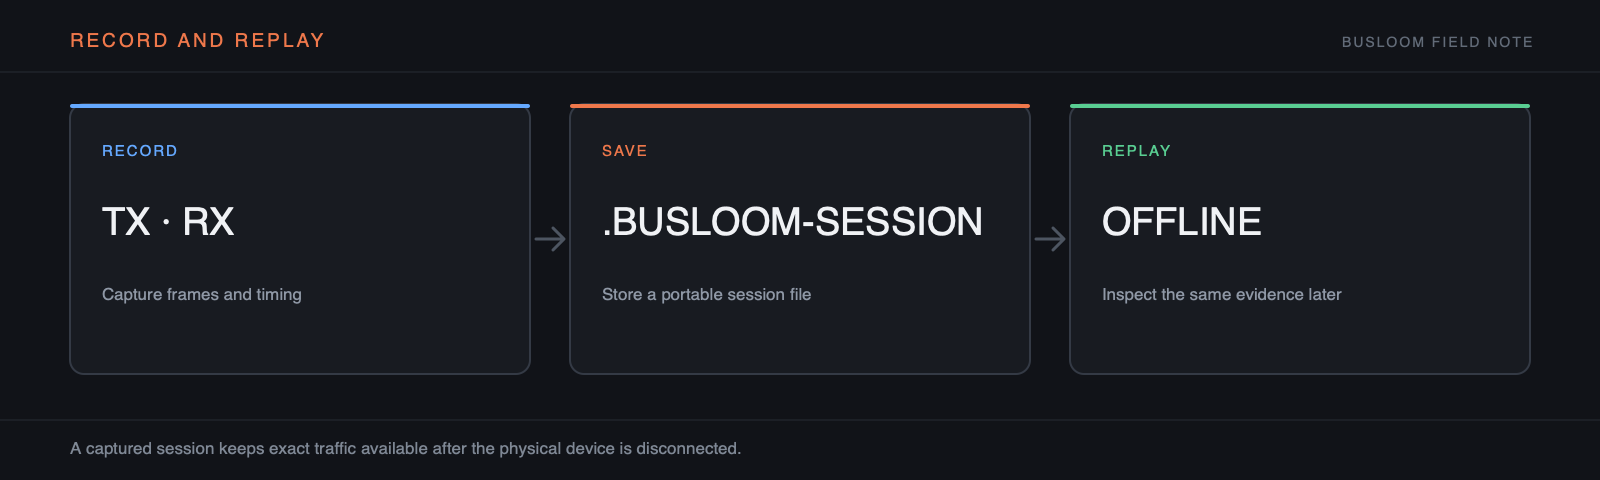
Save the project after reviewing private endpoints and certificate paths. Add the native session and a short note describing expected versus actual behavior. Export CSV or a report for convenience, but keep the original session as the inspectable evidence.
Record a question, not an endless session
Define what the capture must prove before starting it: a setpoint response, an intermittent timeout, a startup sequence, or the relationship between two measurements. Include a short baseline before the event and enough time afterward to see the system settle. A bounded capture with a known trigger is easier to inspect and share than hours of undifferentiated traffic.
Write down the device state, firmware, connection profile, active sources, polling intervals, and operator action that marks the event. If the process clock and workstation clock differ, record that too. The timestamp is only useful when everyone knows which clock produced it.
Choose a sampling interval that can show the event
A Trend cannot reveal a transition faster than its source polling interval. If a value changes for 100 ms while it is read every second, the capture may miss it entirely. Faster polling also changes bus utilization and may disturb the device, so measure the available timing budget rather than selecting the smallest number in the UI.
Keep protocol traffic when timing or causality matters. Trend samples show the values Busloom accepted; Raw Traffic shows when requests were sent, when responses returned, and whether retries or exceptions occurred. Together they distinguish a real process plateau from a stale value caused by failed communication.
- Capture a baseline before the action
- Mark the operator or automation trigger
- Retain failed requests and retries
- Stop after the expected settling window
- Add a short expected-versus-observed note
Replay before exporting a flattened file
Open the native recording without the device and verify that the relevant sources, timestamps, frames, units, and alarm transitions are present. Trim the explanation, not the evidence. CSV and screenshots are convenient for reports, but they may omit transaction relationships, decode settings, or data that was not visible at export time.
Keep the original recording as the source artifact and derive smaller exports for each audience. A firmware developer may need raw frames; a commissioning report may need a chart and alarm timeline; a vendor support case may need both plus the project map. Redact credentials and private endpoints before the package leaves the organization.